More about the SLog colour and gamma space
SLog2 Redux

Our original SLog article ([a|fs700slog8bit]) created some discussion around the results, with quite a few believing that the camera is capable of more than we showed. Just to reiertate here, we showed a very conservative and useful range. The point at which you feel there is no detail is dependent on how much noise you accept. Of course the transmission step wedge used to test with could be at fault (unlikely) but i think the real reason is that this kind of testing is a little flawed if you take absolutes from it. Art Adams did a series of tests too, in his workflow he concentrated on the green channel to test with, we did the red channel which is usually a worst case scenario. Also if the white balance is off slightly that will also affect the results.
So in the spirit of due dilligence i did a test using a reflectance card instead and tried to maximise the results using denoising techniques and being very very careful.
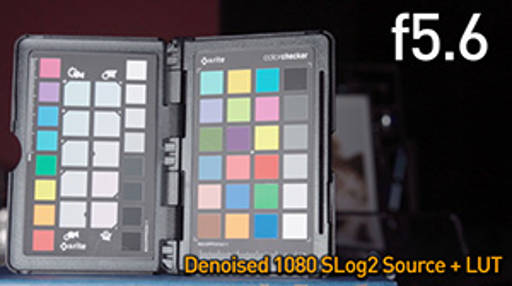
The idea is to shoot a macbeth chart (we only have the little passport one, but that's good enough). We start with a lens at f2.8 and exposed so that the 2nd chip on the grey scale is just blown. That's the highest point. Then stop down the lens, f4, f5.6 ... all the way to f22. From f2.8 to f22 is 6 stops of range. Then at this point we engage the ND filter, which on the 700 offers 2 stops, 4 stops and 6 stops of ND. So from f2.8 we have 12 stops of range. Then at the lowest point (f22 and ND6) we see how much of the grey scale chart is still visible and add those chips to the overall range.
The post workflow involves taking the ProRes files into After Effects, denoising it and then applying the Sony SLog2 LUT. So on our results you see the SLog original (top left) and the image after the LUT has been applied (top right). Then to make it easier to see we have two versions of that, 4 stops over (bottom left) and 4 stops under (bottom right). This exposure adjustment is digital within After Effects, we make the images brighter or darker using the exposure control. This has two uses, one is you can see how much the image can be pushed around and secondly when it comes to looking at the darkest image it's easier to discern the details.
[i|f28.jpg|full|preview]
[i|f8.jpg|full|preview]
[i|f22.jpg|full|preview]
[i|f22nd6.jpg|full|preview]
So if you take a look at the 4 images above (click to expand). You'll see that from f2.8 (the second chip from whitest) all the way to f22 ND 6 (12 stops) and the chip is still clearly visible. In fact you can see further up the 5 chips on the chart. It's been difficult to pin down exactly what the values are on the macbeth chart in terms of stops. The range from white to black is 5 stops worth, and i'm pretty sure each chip is a stop but the densities vary a little. I would be hesitant to pull a precise reading from this but you can just about see 2 steps up. So you could just about say 14 stops, but in my typically conservative style well, perhaps 13.5. These last two stops, as shown before, are pretty noisy.
[i|rangesummary.jpg|full|preview]
Soon i will be able to compare a BMD and FS700+Odyssey, this will hopefully show two RAW cameras side by side. I'm looking forward to seeing 4K out from the 700, because i believe that 4K denoised then scaled to 2K will produce some clean images. It would be useful to try the same test then and see how the 700 compares with a better codec.
X